APV-I AVAILABILITY EVOLUTION
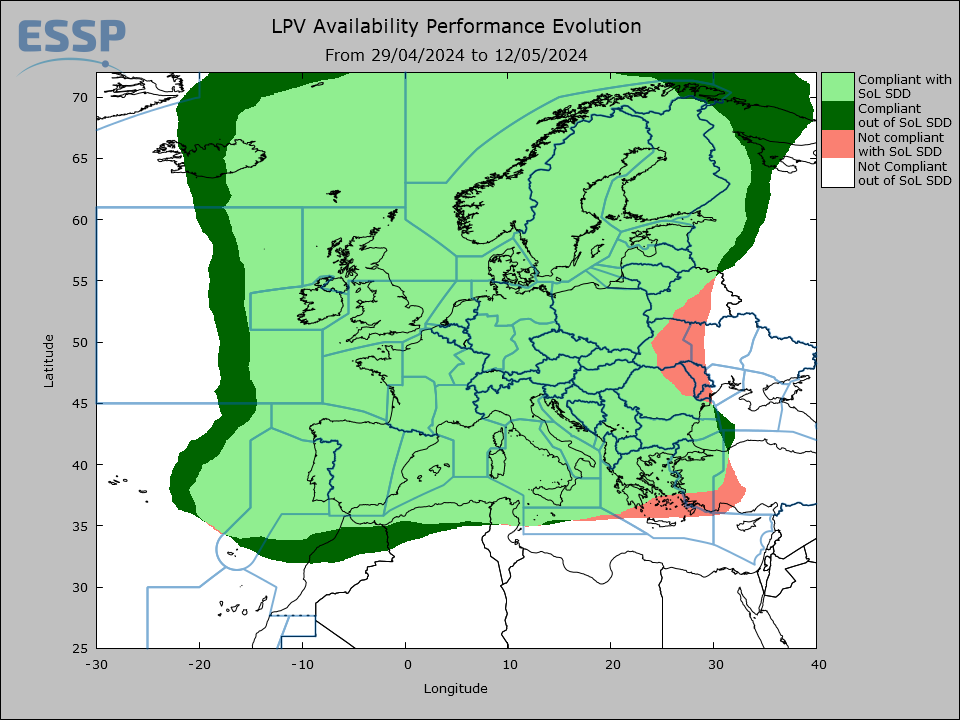
The purpose of this section is to provide an overview of the past APV-I performances necessary to perform RNAV approaches down to LPV minima) over the EGNOS service volume. The picture below shows the status of these performances averaged during the last 14-calendar days period. This map is daily updated.

In the picture, the following areas can be observed :
- Compliant with SoL SDD : the part of the Service Area* where APV-1 availability is at least 99%.
- Not compliant with SoL SDD : the part of the Service Area* where APV-I availability is lower than 99%.
- Compliant out of SDD : area not included in the Service Area* where APV-I availability is higher than 99%.
- Not compliant out of SDD : Any other area outside the Service Area* where APV-I availability is lower than 99%.
*Service Area is the 99% APV-I Availability area depicted in figure 10 of the EGNOS Safety of Life SDD
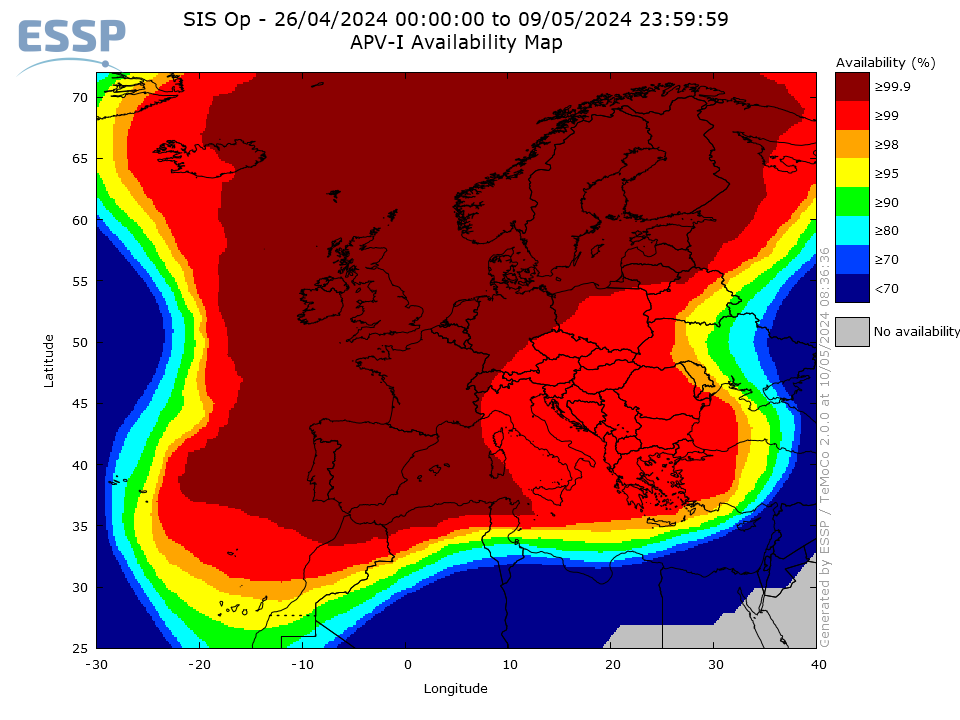
In the picture below it is depicted the actual combined APV-I availability averaged during the same period of time.

DISCLAIMER: Presented data cannot be considered as a guarantee of LPV availability over the depicted area in the future. Therefore, this information should not be used for flight planning purposes and does not supersede the information provided in the applicable NOTAMs. Aviation users should also observe the limitations and conditions set forth in section 2.3.3 of the EGNOS Safety of Life Service Definition Document (SDD). This information is also subject to this website Legal Notice.
Specific APV-I availability data per airport averaged during the last 14 days are available in the table below.

